


1) How To Use Graphic And Charts
- Select the slide where you want the chart to appear.
- In the Insert tab, under the Illustrations group, click on CHART
 to open the Insert Chart dialog.
- Select the type of chart from the category list on the left, or simply scroll through the gallery on the right to view all the available charts. Once you have made your selection, click OK.
- The chart will appear on your slide, and Excel will open as a split screen with dummy data already filled in.
- Add your data and labels to the Excel spreadsheet and the chart will be automatically updated on your slide.
- When finished, click the
 in the upper right hand corner of Excel to close the worksheet..
Changing To a Different Chart
PowerPoint makes it easy to change the type of chart you are using without needing to start over and re-add all your data. You can make this change even after you have applied formatting (see below).- Right-click on the chart you would like to change and select Change Series Chart Type... to bring up the Change Chart Type dialog.
- Make a selection and press OK.
Updating a chart
After creating a chart you may want to update, add, or delete information.Changing Values
- Click on the chart to select it.
- The Chart Tools tabs appear, including separate tabs for Design, Layout, and Format.
- In the Design tab under the Data group click on EDIT DATA
. Excel will open in a splitscreen with your chart's data.
- Change your data. Your chart will be updated automatically when you press [Enter] or click outside of the cell.
- When finished, click the
Adding Data
- Click on the chart to select it.
- The Chart Tools tabs appear, including separate tabs for Design, Layout, and Format.
- In the Design tab under the Data group click on EDIT DATA
- If needed, drag the lower right hand corner of the data range to add rows or columns. Type the new data in the appropriate location. If you add the data to a new table or row, the data will automatically be added to the appropriate place on your chart.
- To update the chart on your slide, press [Enter] or click outside of the cell where you've added data.
- When finished, click the
Deleting Data
- Click on the chart to select it.
- The Chart Tools tabs appear, including separate tabs for Design, Layout, and Format.
- In the Design tab under the Data group click on EDIT DATA
- In the Excel worksheet, select the individual values you would like to delete, or click on the row or column identifyer to select an entire row or column.
- Press [Delete]. The chart is updated on the slide.
- When finished, click the
Customizing a Chart
When you add a chart to your slide, PowerPoint chooses the formatting based on the theme of your slide. All of the elements of your chart can be customized, however, either by using another preset or by modifying the elements individually.
Preset Formats & Styles
For a quick way to change the look of your chart without having to change every individual element, PowerPoint provides a number of layouts and color schemes for each chart.
- Click on the chart to select it.
- The Chart Tools tabs appear, including separate tabs for Design, Layout, and Format.
- To change the layout of your chart, in the Design tab under the Chart Layouts group, scroll through the layout gallery and select a new layout to apply it to your chart.
NOTE: The layouts available will depend on the type of chart selected.- To change the style of your chart, in the Design tab under the Chart Styles group, scroll through the style gallery and select a new style to apply it to your chart.
NOTE: The styles available will depend on the type of chart selected.


Changing Elements Manually
PowerPoint lets you choose from among many elements to display on your charts -- labels, gridlines, data points, etc. You can add or delete these elements at any time.
NOTE: The elements available for editing will depend on the type of chart chosen.
- Click on the chart to select it.
- The Chart Tools tabs appear, including separate tabs for Design, Layout, and Format.
- In the Layout tab select the element you wish to change and choose the new formatting.
Use the drop down menu in this group to select specific elements of your chart to modify.
Format Selection: This brings up the Format dialog where you can modify the formatting for your selected chart element.
Reset to Match Style: This button will clear any custom formatting you have applied to the selected element.
Chart Title: Add, remove, or position the chart title.
Axis Titles: Add, remove, or position the text used to label each axis.
Legend: Add, remove, or position the chart legend.
Data Labels: Add, remove, or position data labels. Use data labels to label the elements of the chart with their actual data values.
Chart Data Table: Adds a table summarizing your data to the chart.
Axes: Change the layout and formatting of each axis. Hides the axes or their labels, switches axes, or changes the measurements displayed with each axes.
Chart Gridlines: Turn gridlines on or off.
Plot Area: Turn the plot area on or off.
Chart Wall: Formats the color on the vertical walls behind the data on a three-dimensional chart.
Chart Floor: Formats the color on the horizontal floor below the data of a three-dimensional chart.
3-D Rotation: Opens the Format Chart Area dialog, where you can set the three-dimensional viewpoint of the chart.
Trendline: Hide or display a line that indicated the average course of data to the chart.
Lines: Hide or display lines at data points which compare the data to other points or the axes, and clarify where each data point falls.
Up/Down Bars: Hide or display bars between the lowest and highest numbers at a given point on the graph.
Error Bars: Hides or displays bars that indicate how much the data may vary from the displayed values, and allows you to set the amount of error.
2) How To Running Presentation
The whole point of a Microsoft PowerPoint presentation is to deliver a show to an audience. If that audience is in the same room with you, you can display your slide show onscreen.
Slide Show view is the view that you use when showing the presentation to others. One slide appears onscreen at a time, completely filling the screen. You may have used this view already — to check your work — while you were creating the presentation.
You can start Slide Show view from the first slide or from the current slide. The following table summarizes the methods of doing each.
| From First Slide | From Current Slide | |
|---|---|---|
| Shortcut key(s) | Press F5 | Press Shift+F5 |
| View tab | Slide Show→From Beginning | Slide Show→From Current Slide |
| View buttons (bottom right of screen) | N/A | Slide Show View button |
Then, after you’re in Slide Show view, you can show your presentation. Here’s how:
- Move to the next slide (in any of these ways):
- Click the mouse.
- Press any key on the keyboard (except Backspace or the left arrow).
- Right-click to display a shortcut menu and then choose Next.
- Move to the previous slide (in any of these ways):
- Press Backspace or the left arrow on the keyboard.
- Right-click to display a shortcut menu and choose Previous.
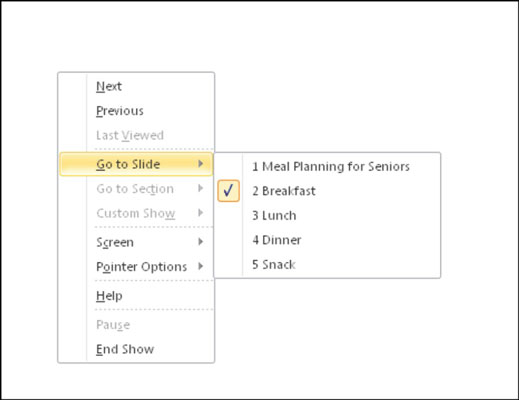
- Jump to a specific slide:
- a.Right-click to display a shortcut menu.
- b.Point to Go to Slide.
- c.Click the slide you want to display.
- End the show (in any of these ways):
- Click through to the end of the slide show (black screen) and then click one more time.
- Press the Esc key.
- Right-click to display a shortcut menu and then choose End Show.
I learned how to use Power Point, example use graphics and charts, use charts and running presentation
No comments:
Post a Comment